Staring down a massive CSV export full of raw click timestamps feels like trying to read the Matrix without the training program. You scroll past thousands of rows of arbitrary numbers, your eyes glaze over, and that $500 you just dumped into a weekend ad campaign suddenly feels completely wasted because you can't figure out why the traffic flatlined. You know the answers are buried somewhere in that messy spreadsheet. But finding the actual human pattern behind the data? Good luck.
That is exactly why the URL Engagement Intensity 24*7 weekly heatmap exists.
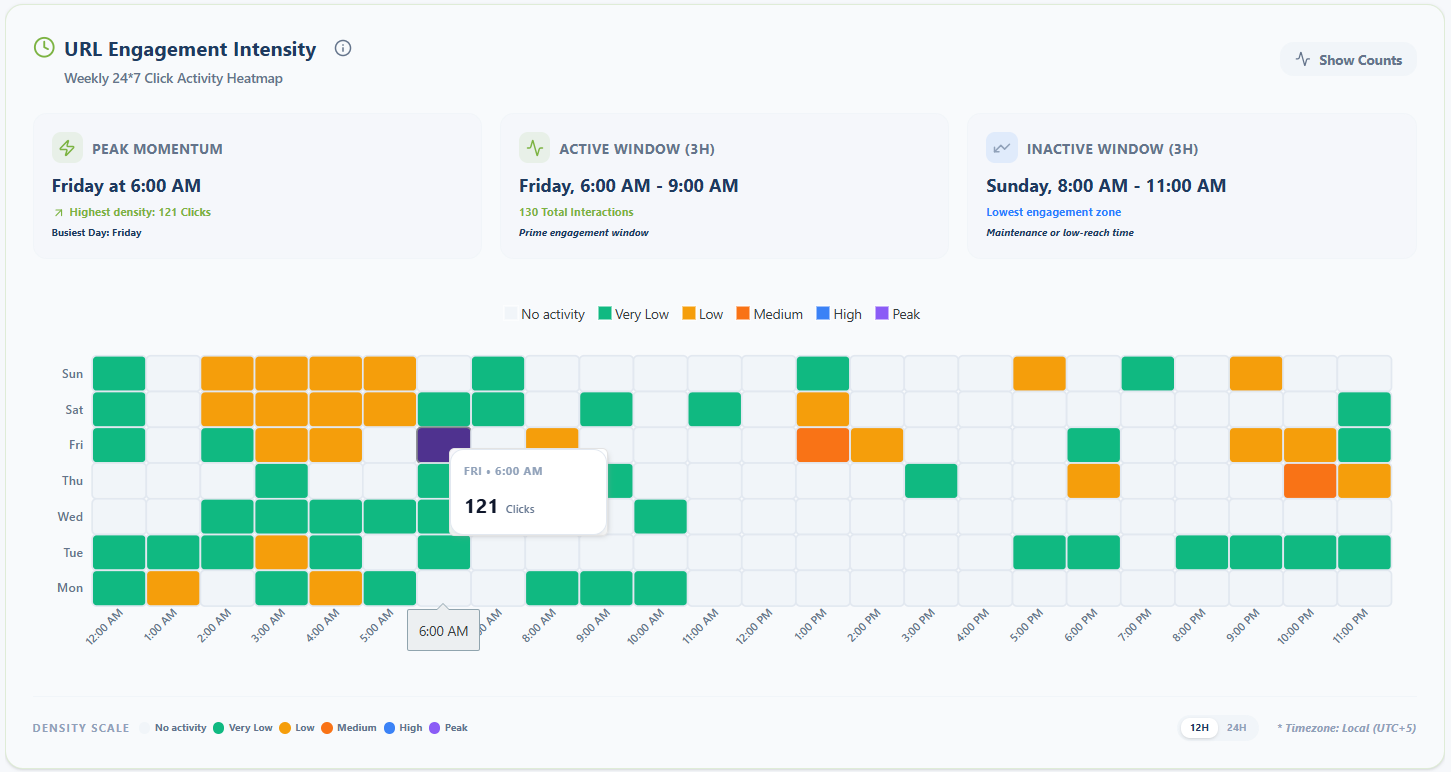
Numbers in a grid are just noise. Color-coded density scales are a map. When you can instantly look at a dashboard and see bright blocks highlighting the exact three-hour window your audience is actually awake and tapping on their phones, everything changes. You stop throwing money at 3:00 AM dead zones. You stop guessing.
Here is how to take those visual hotspots and weaponize them.
The Pre-Requirements— First Get the Data
But wait. You can't optimize a blank screen.
If you aren't actively tracking your links right now, your heatmap doesn't exist. Before you can squeeze extra revenue out of your campaigns, you have to build the actual feedback loop. Here is the exact process to turn the lights on.
Step: Route Everything Through Trackable Links:
Stop pasting raw, naked URLs into your campaigns. It's reckless. Every single time you drop a standard link into an email blast or a Facebook ad, you are literally throwing away behavioral data. Every asset needs a tracking layer. A social bio link. A CTA button in your welcome sequence. An SMS blast. Even that physical flyer with a dynamic QR code sitting on a coffee shop counter. Funnel every single one of them through a dedicated URL shortener like jmpy.me. This is the engine. It silently grabs the exact timestamp the millisecond a user clicks, storing it away to feed your visual matrix later.Step: The Baseline "Blind" Run:
Now you have to cast a wide net to buy some raw material. Launch your initial campaigns using your best-educated guess. Maybe you follow some generic marketing blog's advice and post on a Tuesday morning. Maybe you just hit send whenever you finish writing the copy. It doesn't matter yet. Just get the links out there in the wild. Let the traffic run for a week or two so the system has actual human behavior to chew on.Step: Analyze and Pivot:
After a week of capturing clicks, that blank dashboard suddenly looks like a localized weather radar. You see the heavy storms of user activity. And you see the completely dead zones where your previous ad spend went to die. You immediately stop the "best guess" nonsense. If a massive, dark block of engagement shows up on Thursday at 9 PM, you stop pushing your main offers on Friday mornings. You take your budget and slam it into that Thursday night window. You stop fighting the current.
So now you have this glowing, localized map of human behavior sitting on your dashboard. What do you actually do with it?
You exploit it. Here is how you take that visual data and turn it into an unfair advantage, here are the 15 ways we talked about earlier.
1. Email Send-Time Optimization:
Stop listening to marketing gurus who tell you to blast your list on Tuesday at 10 AM. That is garbage advice. Why? Because they don't know your specific subscribers. Maybe your list is full of night shift nurses or weekend woodworkers. Look at your heatmap. Find that specific block where the colors start shifting from pale to dark. That is your upward trend. You queue up your massive email drop for exactly 45 minutes before that peak window hits. Now your email isn't buried under fifty other promotional blasts from brands who scheduled for the top of the hour. It is sitting right at the absolute top of their inbox the exact second they grab their phone and open the app.
2. SMS & Push Notification Precision
SMS marketing is a loaded gun. It works incredibly well. But if you misfire, you piss people off instantly. Imagine getting a promotional text from a supplement company at 4:30 AM when you are trying to sleep. You don't buy vitamins. You instantly reply "STOP" and block the number. That is a lost customer forever. Look at your "No Activity" zones and treat them like radioactive wastelands. Never trigger a push notification during those blocks. Instead, find the absolute highest density data points on your dashboard. That means they are already holding their phones. They are swiping, reading, and clicking. Drop your SMS offer right then. The friction is zero.
3. B2B vs. B2C Persona Profiling

Sometimes you think you know exactly who is buying your software or reading your content, and the data tells you that you are completely wrong. A quick glance at the Day/Hour matrix strips away the assumptions. If you see a heavy cluster of solid blocks from Monday to Friday, straight between 9 AM and 5 PM, you have a strict B2B crowd on your hands. They are clicking while they sit at their office desks avoiding actual work. But what if your heatmap is glowing heavily on Thursday nights and Sunday afternoons? You are selling to B2C retail consumers killing time on the couch. You can instantly shift your messaging tone based on this. Stop sending stiff, corporate language to the Sunday afternoon crowd.
4. Budget Pacing for Paid Social Ads
Handing Meta or Google a daily budget and letting them pace it evenly across 24 hours is a rookie mistake. It bleeds your account dry. Why pay the exact same cost per impression at 3 AM when your audience is asleep as you do at 8 PM when they have their credit cards out? Look at the 3-hour "Inactive Windows" on your chart. Go into your ad accounts and set strict dayparting rules to shut off your spending during those dead zones. Take those saved dollars and stack them entirely into your highest-density hours. You bid aggressively when it actually matters, driving your Cost Per Acquisition straight into the floor.
5. Webinar and Live Event Promotion
Getting people to actually show up to a live webinar is a nightmare. Half the registrations forget, and the other half get stuck in meetings. You have to stop fighting their natural offline hours. If your heatmap consistently shows Thursday at 2:00 PM as a massive, dark active window, that is exactly when you host the event. Not Friday at noon because it is convenient for your sales team. You force your live events into the exact time slots where your audience has repeatedly proven they are engaged, online, and willing to click.
6. Customer Support Resource Allocation
Traffic spikes are great right up until your live chat crashes and angry users start tweeting about your terrible response times. Clicks equal traffic. Traffic equals questions. If your heatmap is glowing red-hot at 11:00 AM on a Wednesday, why is your only customer support rep taking their lunch break at that time? Hand this visual map to your success team. Force them to overlap their shifts and staff up exactly when the momentum hits. It eliminates that frustrating lag when a warm lead has their credit card out but hits a wall of silence.
7. Retargeting Window Activation
Retargeting someone three days after they looked at your pricing page is just throwing pennies down a well. They already forgot you exist. You have to hit them while the initial dopamine spike is still active. If your heatmap shows a massive surge of clicks at 8:00 PM, you don't wait for some generic daily ad schedule to reset at midnight. You set your heavy retargeting campaigns to trigger at exactly 8:30 PM. You shadow them while they are still holding their phone, still sitting on the couch, and still in a buying mindset.
8. Flash Sale "Golden Hour" Execution
You can't start a riot in an empty room. Flash sales usually fail because founders panic and launch them when traffic is dead, hoping the discount will magically wake people up. It won't. Find the absolute darkest, most concentrated color block on your entire matrix. That is your single highest engagement hour of the week. That is your room full of people. Drop a vicious 60-minute flash sale exactly inside that block. The conversions will be explosive because you aren't trying to generate attention from scratch. You are just hijacking the attention that is already there.
9. Influencer Marketing Accountability
We have all been burned paying an Instagram influencer thousands of dollars for a story shoutout, only to get a handful of garbage clicks. Follower counts mean absolutely nothing today. It is mostly vanity metrics and bot farms. But they can't fake the heatmap. When you hand them a jmpy.me tracking link, check the matrix 48 hours after the post goes live. If they post at 5 PM and there is no corresponding dense spike of activity during that window? You have hard, undeniable visual proof that their audience is completely dead. And you never pay them a dime again.
10. Offline-to-Online QR Code Tracking (Print & OOH)

Spending money on physical mailers or billboards usually feels like setting cash on fire because you can't measure the return. But when you slap a dynamic QR code on a physical flyer or product packaging, you force the real world to talk directly to your digital dashboard. The heatmap suddenly exposes physical human behavior. A bright spike every weekday morning at 7:00 AM? That tells you your billboard is catching the exact morning commute you paid for. Or it tells you that direct mail piece is getting scanned on the kitchen counter right before people head to the office. You finally get to see what happens offline.
11. A/B Testing Engagement Peaks
Running split tests that just spit out a generic conversion rate at the end of the week is only giving you half the story. You need to see when the conversions happen. Let's say you throw out two different jmpy.me tracking links to test a new messaging angle. You put the heatmaps side-by-side. Link A just bleeds a pale, boring "Medium" traffic block all week long. But Link B? It stays completely dark until it violently erupts into a massive "Peak" block on Saturday at 9 PM. That tells you the copy in Link B is an absolute weekend killer. You pull it from the weekday rotation immediately and save your entire budget to blast it on Saturday nights.
12. Global Time zone Alignment
Managing international ad accounts makes you want to pull your hair out. The timezone math is awful. The beauty of a localized heatmap is that it maps global chaos right to your own local dashboard. If you are sitting there looking at your screen, and you see a massive density spike ripping through at 3:00 AM your time. That isn't a glitch. That is an entire overseas market waking up, drinking their coffee, and swiping through your content while you sleep. You don't ignore that kind of signal. You spin up a highly specific, geo-targeted ad set for that exact region.
13. Identifying "Content Fatigue" Zones
Ad fatigue is a silent killer. You launch a killer creative, the clicks roll in, and then you just let it run on autopilot until it slowly bleeds your daily budget dry. Look at your matrix week over week. Watch for a dense, active block that slowly fades into a pale "No Activity" zone. That visual fade is the canary in the coal mine. It means your audience is sick of looking at your banner. They are literally ignoring you. It is a hard stop. You pause the campaign, rip out the old creative, and inject something completely new.
14. High-Ticket B2B Sales Cadences
Watching sales reps dial blindly through a lead list hurts my soul. It is incredibly inefficient. They catch people in meetings, in the car, or right as they log off for the day. Stop letting them do that. If you drop a whitepaper link to a list of B2B leads, look at the heatmap. If the dashboard lights up like a Christmas tree strictly between 10:00 AM and 11:30 AM on a Tuesday, that is your golden window. You force your sales team to block their calendars and dial relentlessly during that exact 90-minute stretch. You hit the leads while your brand is actively occupying space in their brains.
15. Website Maintenance & Downtime Scheduling
Pushing a database migration at 2 PM on a Wednesday and watching your site crash while active users are trying to check out is a special kind of hell. I've done it. It costs you money and burns user trust. Pull up your matrix and find the absolute lightest, emptiest blocks on the entire grid. Maybe it's Sunday morning at 8 AM. That is your designated window to break things. You schedule your heavy plugin updates and server reboots right there. If the site goes down, practically nobody notices.
Start Flowing With Your Audience
Data is entirely useless if it just sits in a database. When you transform raw clicks into a literal map of human behavior, you stop guessing and you stop fighting the algorithms. You just flow exactly where the attention already is. Wrap every single campaign asset in a tracking link today. Build the baseline. Then turn those visual hotspots into actual, banked revenue.
Share this insight
Help others grow
0 Shares