Unlock the metrics behind your physical marketing. Track every scan with enterprise-grade precision and turn offline engagement into actionable intelligence.
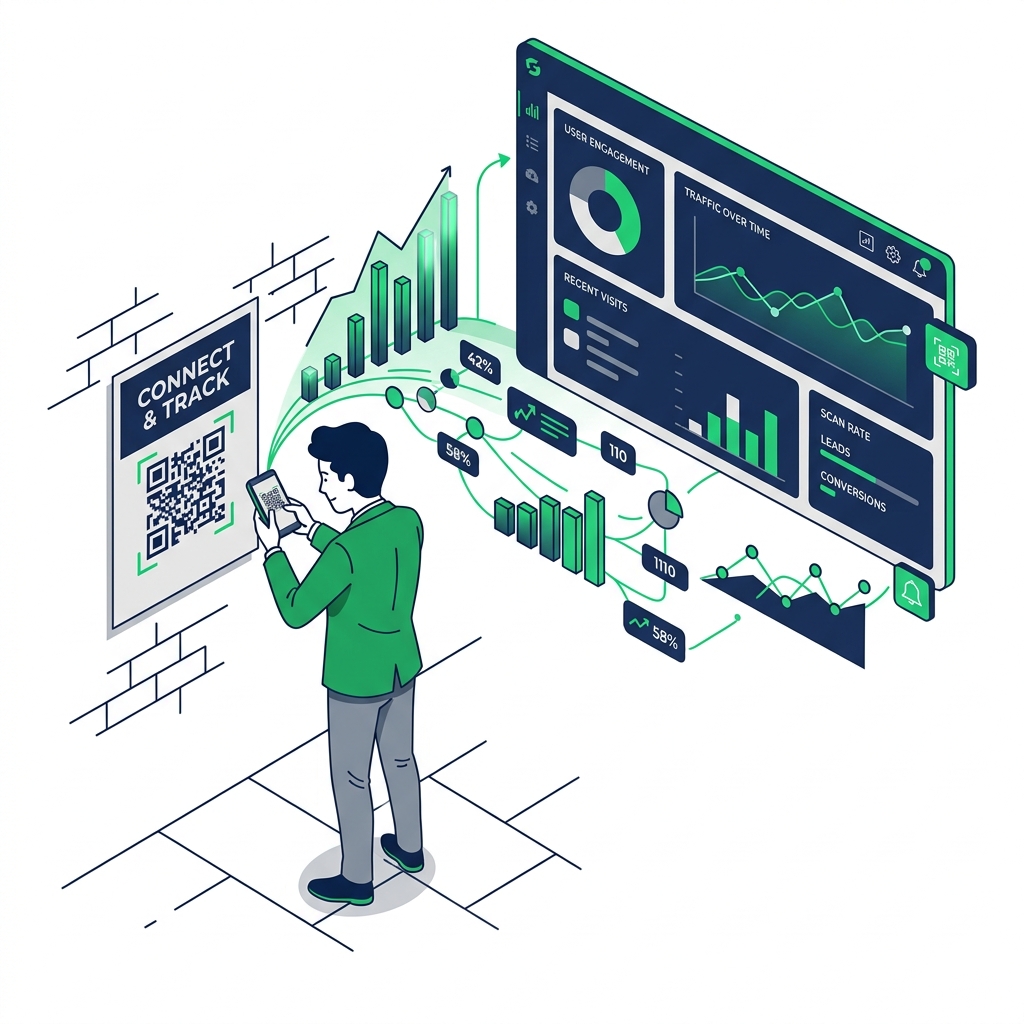
Offline marketing is no longer a black box.
Our Unified Channel Attribution engine automatically identifies physical interactions, providing a clear breakdown of your omni-channel performance.
Every scan is tagged with its physical context, allowing you to attribute traffic to specific locations, products, or campaigns.
Distinguish between direct scans and social/web links instantly. No more messy data silos.
We provide the level of detail typically locked behind enterprise paywalls. Optimize your physical marketing with the same rigor as your digital ads.
Track the journey from the physical world to your digital assets. Measure the ROI of your printed materials with precision tracking.
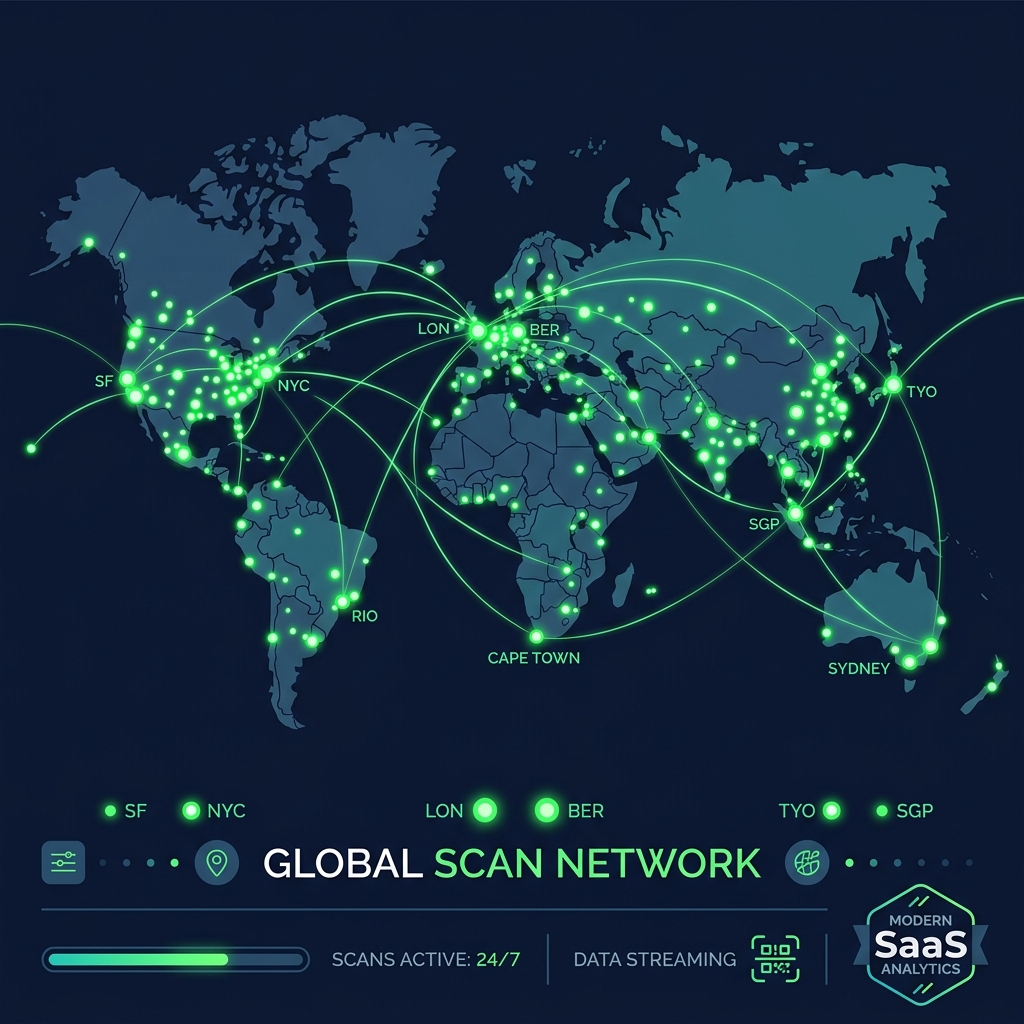
Identify hotspots where your codes are scanned most. Our geographic intelligence provides country, region, and city-level data heatmaps.
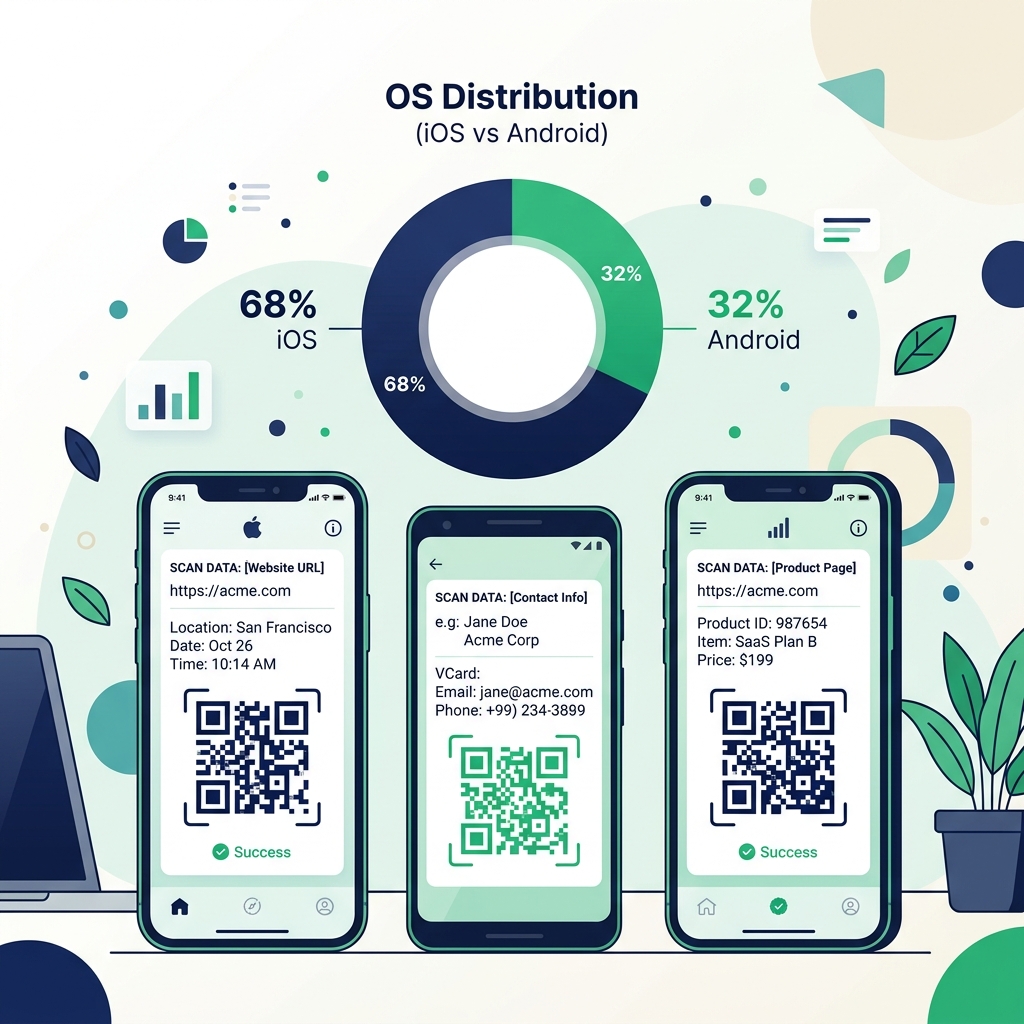
Know what hardware your audience uses in the field. Track OS versions, browser types, and device configurations used for every scan.
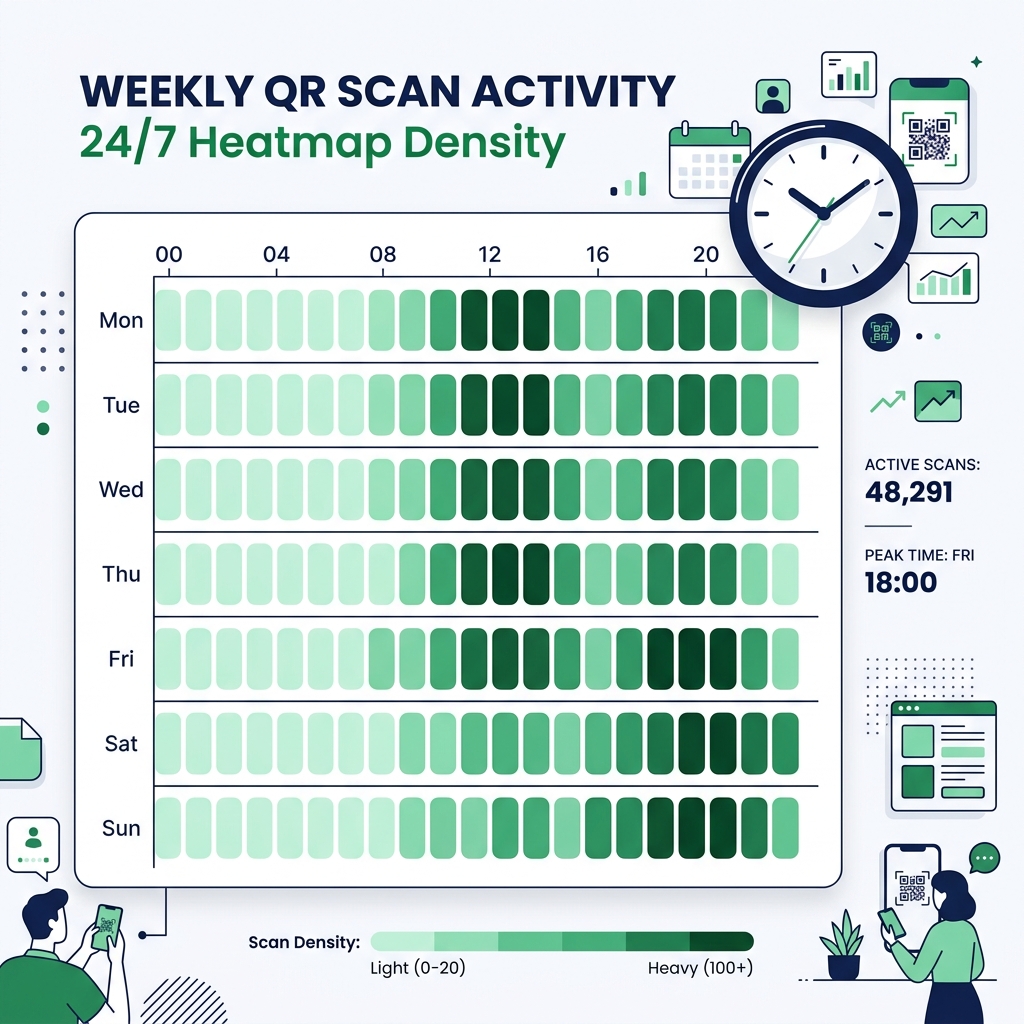
Pinpoint peak scan hours. Use hourly distribution and 24/7 weekly heatmaps to understand when your physical presence is most effective.
Our engine automatically distinguishes between physical QR scans and digital browser clicks, giving you a clear view of your channel performance.
Watch scans happen as they occur. Our live interaction feed provides instant metadata for every event with millisecond precision.
Identify hotspots with city-level accuracy. Our multi-provider IP intelligence engine tracks exactly where your audience is scanning, allowing you to optimize physical placements.
Know which neighborhoods drive the most scans.
Visualize global reach in a single, high-res view.
Our Weekly Engagement Heatmap provides a 24/7 view of your physical interactions. See every scan across 168 hours of the week to identify recurring behavior patterns.
Pinpoint exactly when people scan your codes during the day.
Identify which days of the week drive peak engagement.
Every scan carries a technical fingerprint. Analyze the OS, Browser, and Device configurations to ensure your destination content is optimized for the user's current environment.
Track Android vs iOS distribution with version precision.
Distinguish between smartphones, tablets, and wearable scanners.
Yes! By using a Dynamic QR code, you can track every scan from any physical location. Our geolocation engine will show you exactly where the scans are occurring with city-level accuracy.
Our Unified Attribution engine uses proprietary detection logic to identify the entry point. Physical scans from cameras are tagged differently than digital clicks from social media or browsers.
Absolutely. Our analytics system processes every event instantly. You'll see scan updates on your dashboard within milliseconds of the interaction.
Yes, if you use a Dynamic QR code. You can update the long destination URL anytime in your dashboard without ever needing to reprint your QR code.
Join thousands of brands using Jmpy.me to track their offline-to-online conversion funnel.